Hi dear RIP readers,
This is Part 4 of my Spreadsheets series. I recommend you to take a look at the previous episodes before reading this one. So far we’ve seen:
- Why I think tracking your finances is important, what to track, my tracking history, and why you don’t need any app but spreadsheets for that (Part 1)
- How I structure my spreadsheets for tracking (Part 2)
- How I track my Net Worth (Part 3)
Today we’re going to deep dive into my “Cash Flow” tracking, i.e. how I track income and overall expenses. Which is not the definition of “Cash Flow”, I know, I’m an amateur accountant 🙂
Deep expenses tracking will be the subject of a future episode.
We’re going to zoom in into the Cash Flow section of the current Yearly Net Worth sheet, within the “RIP Net Worth” spreadsheet. This deep dive happened in September 2020, so I’m using the “2020 NW” sheet, populated up to column L: “Sep”, whose Cash Flow section spans from row 105 to row 126 at the moment.
Enjoy!
Cash Flow Section

The Cash Flow section tracks income, expenses, and savings per month. It’s called Cash Flow for historical reasons, but it’s actually (more or less) an Income Statement. It’s not tracking cash movements for the month. What I want to keep an eye on is how much we earned and how much we spent on any specific month, even if some of these earnings/expenses are hitting/leaving our bank accounts in a different month.
The top 4 rows (106 to 109) are our main sources of income, and they’re pretty straightforward: salaries and dividends.
The following two rows (110 and 111) are expected income and wealth tax for this month. We already covered that in the taxes subsection of part 3. We also already covered rows 112 and 115, the expected rates for wealth and income tax there. Maybe I should reshuffle rows and put tax rates and actual amounts close together.
The two weird rows 113 and 114, namely “Gross –> PreTax” and “Gross –> Net” have not been used this year and I’m going to remove them next year (or this year as well). They were convenient multiplicative factors to convert a gross bonus into expected payslip pre-tax payments (PreTax), and final expected net value (Net). I’m not receiving bonuses anymore (so sad), so these two rows are useless and they’re just polluting the section.
Pillar 2 contributions: rows 117 and 118 represent the total amount (mine plus employers) that goes into my Pillar 2, excluding costs and risk premiums, split in mandatory an extra-mandatory.
For your exact numbers, you need to be able to read the Pillar 2 statement you receive once or twice a year by your Pillar 2 provider. It’s not enough to take your Pillar 2 (BVG) contributions from your payslip since they likely include some costs and risk premiums.
I consider the “capital” component of my Pillar 2 contributions part of my Net Worth, because it’s money I can withdraw anytime under specific conditions.
If I hadn’t withdrawn all of it before statutory retirement age (currently 65 for men), I’ll consider whether to convert the remainder (or part of it) into an annuity – and mess up my NW.
Row 119 is the expected monthly taxes on my Pillar 2, assuming I’m going to withdraw it before retirement age, and assuming the lump sum tax rate indicated in the row below (row 120). We’ve already covered that in the taxes subsection of part 3.
Total income (row 122) is the good old SUMIF expression we’ve seen in total NW of part 3.
It’s also the place where other minor incomes are collected, and explained with comments.

Please, PLEASE, do not resolve the comments on the doc. They’re there for informative purpose. Google Sheets don’t allow me to share the spreadsheet with read-only comments. I spend too much time in reopening comments you resolve. If this trend continues, I’ll have to change sharing settings and hide comments. Thank you.
Spending (row 123) represents the total monthly expenses. Individual expenses are tracked in a separate spreadsheet in my private environment. More about this in a future episode.
The way I import the total here in my private environment is via IMPORTRANGE function.
for example, September 2020 expenses are imported here via:
= IMPORTRANGE ( <spreadsheet_url>, L1&”!H2″)
Where spreadsheet_url is my expenses spreadsheet, and the second parameter is a string concatenation between the value of cell L1 in this sheet (“Sep”) and “!H2”. That’s “Sep!H2”, which is cell H2 in the sheet Sep, in the spreadsheet “spreadsheet_url”. The expenses spreadsheet has a sheet per month, named “Jan”, “Feb”… like the for row of this sheet so that at snapshotting time, the formula works for the next column as well 🙂
Note that I’m referring to my private environment. In my public spreadsheet, you see that I import total expenses via referencing a cell in a different sheet (the “2020 Exp” sheet). That’s because, as I said, in my private environment I track expenses in external (yearly) spreadsheets.
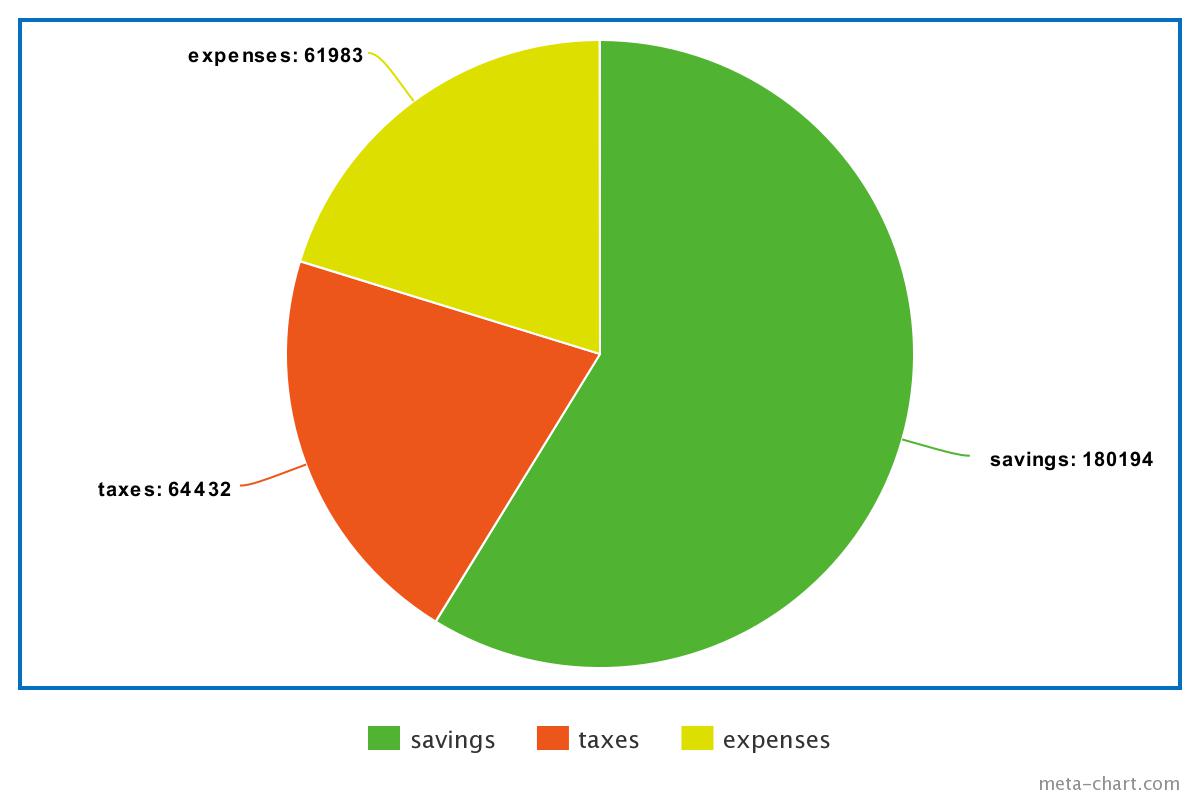
“RIP, your taxes are comparable to your expenses… why don’t you consider taxes as expenses, like indeedably suggests?”
Well, they used to be identical in 2018… expenses grew a bit over the last two years 🙁
Anyway no, I don’t consider taxes as expenses even though in Switzerland there’s some degree of control you have over taxes, like changing Canton and Municipality of residence, dropping money into pension funds, donating to charities, and few more.
I don’t consider taxes as expenses because we won’t have to pay them once retired (not exactly true for Wealth tax if we’re staying in Switzerland). The goal of tracking net income, net expenses, net savings, and saving rate is to really get a picture of how our disposable money are flowing.
Rows 124 and 125 track the absolute savings and the saving rate, that someone considers the only factor that matters in your FIRE plans.
Column P, as always, is the annual (or YTD for current year) recap. column R and S are averages and forecasts. I rarely look at them. They might disappear soon.
Data from this section are pulled by the net worth subsection (other-CHF/EUR/USD) and by the Income sheet, where I collect all incomes across the years and have nice graphs and blah blah blah

“Cool! how can I create a graph myself?”
Do you want me dead? I’m not going to make a Google sheets graph tutorial bro.
Btw, look at this other one in the “2020 Exp” sheet about income and Expenses together 🙂

The ratio between the areas below the two curves is a measure of the saving rate over the year 🙂
That’s all for today!
Have a nice day
This series on how to interpret your spreadsheet is extremely helpful, thank you!
But… how do I create those cool graphs myself? 😀
Ok ok. Just one graph at least!
Haha ok, maybe I’ll do a bonus stage on graphs 🙂
Check last episode on FIRE Metrics, at the moment the series is taking a break.