I will invest when the market drops!
Welcome back my imaginary friend 🙂
What do you mean, exactly?
P.S. You look amazing in blue!
Thanks 🙂 Hey RIP, I have some cash I would really like to invest… but market is high right now and I prefer to wait next deep or a big crash.
Wait, isn’t “a crash” just happened? Last “all time high” happened more than 2 months ago, on Friday January 26th 2018. We’re in April now and we’re still ~9% below the peak!

So the crash already happened, what are you waiting for? 🙂
Well… I thought it would fall more. I still think it will. I think it will soon drop 30%.
Really? So why don’t you short it!
Short what? What does it mean?
From Investopedia:
Short selling is a fairly simple concept: you borrow a stock, sell the stock, and then buy the stock back to return it to the lender.
Short sellers place a bet that the stock they sell will drop in price.
I see you want to earn big money, to be super smart. Here you go! Short a S&P500 ETF and you’re done!
Well… that’s too risky. I don’t know…
Why is that risky? Aren’t you sure that the market is going to fall deeper? Isn’t this the reason why you’re holding on cash?
If you think there’s a reasonable probability that today’s price is not the absolute minimum from now on, then you should short!
No, I don’t like exotic investments like short selling. You always advice against that, am I right? I just want to wait and… boooooom buy a lot of shares of my S&P500 ETF when the market will crash!
Yes, I advice against exotic investments. I also advise against timing the market though 🙂
By the way, let’s quantify your issue. Did you set a limit price for buying? Something like “when the S&P500 will be below 2000”?
I once read (can’t find the source though) about a bloggers family investing mistake. It was year 2011. After 2 years of bull market the S&P500 went from 735 points of the 2009 bottom to 1300 in early 2011. It essentially recovered 90% of the whole 2008-9 recession in less than 2 years.
They sold everything and waited for another crash. They set a limit buy order on S&P500 index at 1000.
They’re still waiting.
Uhm… not actually a limit price. I’m just waiting for a standard crash, something like “the market drops at least 20%”.
So is 20% the magic number?
No no no, I don’t know. Maybe 30% or 10%. No wait, 10% just happened…
So it’s 30%.
Anyway, the actual value doesn’t matter much.
You don’t know, we don’t know, what would be the shape of the next crisis.
Bad markets have many shapes. And almost any new bad market wears a new dress.
Just to show you few samples, here are few bad market periods from the past:
1) Very deep death: 1929 crisis.

1929 crisis pushed so many people to go nuts. Some killed themselves. It’s been harsh, diabolic. Stock Market lost almost 90% from peak. And there were no index funds, which means a lot – A LOT – of companies went broke and people lost all their money. It took almost 3 years to reach the bottom, with fake recoveries along the way. Imagine how it would have felt to you to keep losing money month after month after month for 3 years! It took 25 years to get back on track! That’s a really bad scenario (where the 4% rule apparently would have worked fine anyway).
What strategy would you adopt here? Imagine you were waiting for a crash. In just two days, October 28th and October 29th 1929, Black Monday and Black Tuesday, the Dow Jones (there were no S&P back then) loses 20%. What do you do? Do you go all-in? Then it loses another 70%. Wait for a bigger crash? Then on October 30th it recovers 14%, you go nuts and go all in. Then it loses 85%.
I’m not telling you to find the best moment to buy or sell in retrospective. It’s easy with numbers on the table! I’m asking you to put yourself in those shoes and imagine how you would have behaved.
But not all crisis look the same!
2) Ultra fast death and then slow recovery: 1987 Black Monday.

Black Monday (October 17th, 1987) is the single worst day in the history of trades. It’s not been a single nation problem, but all the stock exchanges around the world lost double digits.
Dow Jones lost 22.6% in a single day. More than the 1929 Black Monday and Tuesday combined!
That seems to be a perfect scenario for a smart investor like you! If you just waited with a bunch of cash at hand on October 18th and then went all-in it would have been an easy win! Or… wouldn’t it?

Actually, Black Monday happened after 5 years of bull market. An amazing bull market! In August 1986 the marked was already at “after Black Monday” levels. If you were holding cash for longer than a year you had lost opportunities. If you sold everything few months before, on February 1986 after several record months and a +100% in 2 years, then you would have never rejoined the race at a lower price.
Fail.
Btw, if your strategy would have been “buy after a 10% drop” you’d have dramatically failed. Before Black Monday the market already lost 15% from its August peak. Maybe you would have placed your buy order the day before Black Monday! What a nice way to “buy low” 🙂
And, just for fun, are you sure you’d have hit the buy button just the day after the Black Monday? What if it was going to be another -90% like in 1929? It’s easy to tell, today. I don’t claim I’d be so cold blooded to buy when everybody else in the world is selling.
But not all bear markets are about high volatility!
3) A f*cking decade long stagnation: the 70s.
The seventies have been the worst economic scenario in retrospective for a candidate early retiree. The 4% rules didn’t work if you were to retire in year 1969. There has been no single remarkable (Black) bad day, but a full decade of zero growth.

What’s your formula here? Wait for a crash? Hold cash? Cash didn’t behave much better. Inflation doubled consumer price index in the decade, while stocks didn’t help.
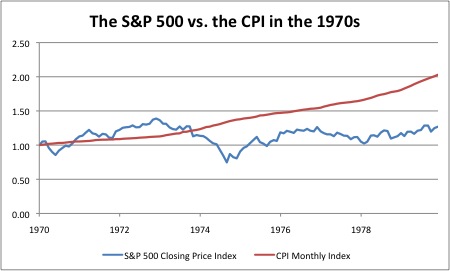
If you waited for a 10% or 20% or 30% drop to jump in you would have missed the 80s!
But yeah, these bad market scenarios are far in the past, what about more recent stock markets extravaganza?
4) A slow death: 2000-2002 dot com bubble.
The dot com bubble was slow and steady. I remember it, I invested during the dot com bubble!

It took 2.5 years to reach the bottom, and all the downhill ride has been accompanied with high volatility. When do you jump in?
And as always, in case you were waiting with cash for such a 40+% drop after a decade of bull market (the 80s), then you would have missed another decade of even more amazing returns: the 90s!

5) A regular deep death and rebirth: 2008 Financial Bubble.
The financial bubble / great recession downhill roller coast has been slightly faster, more extreme and brought unemployment, recession and poverty. But how would you, my smart investor, have invested?
Note that I’m not trying to show you how to exploit the situation and laugh over the depression and (luckily temporary) poverty that happened right after. I’m trying to show you how hard it would have been to beat, or just meet, the dead investor, i.e. a “buy and hold forevah” investor!

Here, let’s take a look at the dot com bubble plus financial bubble together. Ok, in retrospective is always easy to find buy and sell dates, but that’s not the game we’re playing. Let’s say you were super smart and you just sold your stocks when “the market was high” and waited for a while “until the market drops 30%”.
That’s more or less what you would have done.

Super smart! You made a lot of money buying low and selling high! You also spotted a pattern, cool! Let’s sell at the end of 2012 and please wake me up when the S&P500 index will be below 1000 again!

How does it feel to have a limit order still unfulfilled? 🙂
6) An apparent death: 2016 Brexit.
In June 2016, UK decided to leave EU. Markets lost 10% in a couple of days, but then suddenly recovered. That looks like an amazing opportunity to buy low!

And yes, it was amazing (again) in retrospective. Those cleaver folks who were holding cash since 2013 waiting for a dip rubbed their hands in anticipation of the crash that validated their theory. But no, there was no 50% crash, no S&P500 below 1k, sorry.
I was lucky enough to have invested ~10k at the end of the second day, but that was thanks to a couple of months savings and some luck.
I hope I showed you how bear markets look and behave differently and how it’s very very hard to benefit from them and almost impossible to anticipate them.
Are you still holding cash?
Yes…
Btw, in which currency?
The Swiss Franc!
Oh poor you! It lost 10% compared to EUR in a year! Why aren’t you timing the market here too 🙂
RIP, don’t make fun of me! How do I know how currencies are going to go? That’s a zero sum game. I obviously prefer to hold cash in the currency where I live and plan to live for a while.
A zero sum game! Well, there are a lot of forex investors that would disagree with that, but I’m with you. I diversify by currency but I don’t bet on anyone in particular. I accept it as a zero sum game.
But the stock market is not a zero sum game! It’s the first axiom of capitalism that we’re all betting in. Do you accept it? Do you believe in long term market growth?
I’m not judging here. I accept that you might think the world is going to de-grow thanks to regular wars, nuclear war, singularity, resources depletion, end of fossil fuel, pandemics, nanotech, zombie invasion, you name it.
But if you think that in 50 years the economy won’t still be growing you have other issues to cope with. You won’t be “waiting for a market crash to invest“. You’d better be buying canned food and weapons (and shorting the market).
I’m still confused when I talk about capitalism and infinite (where infinite is a least 50 years) growth. I’m a living example of a conflicted person, having believed in Happy Degrowth till 10 years ago. But if you ask me to bet, I still think that in 50 years we either wiped out ourselves or we will be in a richer world for everyone, thanks to space exploration, life science, solar energy, fast transportation, global market, artificial intelligence, universal basic income, you name it.
RIP, wait, I’m not a survivalist and I do believe we’re going to keep growing in the future. But don’t you think there’s going to be a bear market sooner more than later? Don’t you think that after 9 years of bull market we’re done with it?
Are you asking me if I believe in the random walk hypothesis? I’ve blogged about it!
In general, I believe that future returns are not correlated to previous performances. Today’s market prices embed all information available, including tomorrow crash probabilities. That’s called efficient market hypothesis.
Now, that’s theory. In practice we’re emotional creatures that don’t always behave according to rationality. We’re actually driven by two monsters named greed and fear. These two enemies account for 90% of our investment errors. The aggregate impact of greed and fear causes market inefficiencies, optimism, pessimism, herd behaviors and market highs and lows detached from actual macroeconomy robustness. That’s why uncle Warren once said:

Greed and fear generate market cycles, as perfectly explained by Ray Dalio.
Are those cycles predictable? Are they exploitable?
Predictability doesn’t work well with second order chaotic systems, as professor Yuval Noah Harari said in the book Sapiens.
There are some data from the past we can try to analyze though. The strongest point against the random walk hypothesis is the mean reversion, i.e. the path that an index takes doesn’t look very random, but tends to stay close to its “average price”. It doesn’t mean that it doesn’t grow, but the underlying slow growth of the real economy is what drives the prices in the long term.
That’s a strong affirmation: it means we can tell if something is overpriced or underpriced today!
The always-amazing Big ERN recently wrote a post on mean reversion, go read it!
So, RIP, truth is that you too believe markets are overpriced, don’t you? 🙂
I have an amazing metaphor for you. Are you ready? 🙂
Imagine you’re walking the dog in the park.
Imagine you’re walking on a straight line, east to west, and you keep your dog unleashed while walking.
You walk at your human slow, steady pace, east to west.
Your dog will run at her fast doggy pace, sometimes preceding you and sometimes lagging behind. But she will not randomly run away (unless she’s a Great Dane, if she’s a Great Dane you’re doomed), she will on average stay close to you.

If halfway you suddenly change your mind and decide to walk back home, she’ll keep free roaming but at one point she runs toward you.
Now, assume you’re walking east to west and your dog is 10 meters ahead of you. Will she go further west or stop and go back east? Can you tell? What if she keeps staying 10 meters ahead of you? What if she accelerates and go 30 meters ahead of you? What if she stops and wait for you? What if she runs toward you and follow your steps? What if she runs toward you, surpasses you and stops 20 meters behind you? Can you really tell?
Sure, she will on average follow your path. Sure, if she’s 100 meters ahead she will probably move closer. But can you really tell?
What I know for sure is that in half an hour she’ll be further from the start that she’s right now, and that’s because the dog owner moved in that direction.
That’s mean reversion. If you trust the steady pace of the economic growth, you shouldn’t care much where the dog is right now.
Nice metaphor, but… RIP… came on admit it! Stocks are expensive right now!
To tell that stocks are overpriced today is a strong claim.
First let me tell you how we usually measure “overpriceness” (copyright MrRIP): The Shiller PE Ratio, also known as Cyclically Adjusted Price to Earnings ratio, or CAPE 10. Mr Shiller won a Nobel Price with his studies, so of course he deserves our attention.

PE of a stock (Price to Earnings ratio) is its total market cap over its yearly earnings. CAPE is the total market cap divided by the average earnings of the last 10 years, and it’s more accurate than PE.
The CAPE can be calculated of an index as the weighted average of its components’ CAPE.
As you can also see from the picture above, high CAPE historically correlates with crashes and recessions.
As you can see american stocks CAPE today is 31, above the peak before 1929 market crash and almost double the mean value of 16.85.
Told you!!
Before you jump to conclusion let me tell you few things.
First, do you think this fact is not reflected in today’s price? If CAPE > 30 means “run run run!!” why isn’t everybody selling?
Second, a CAPE value of 30 means the company is valued 30 times its last 10 years average earnings. If you buy all the stocks of a company with CAPE 30 and cash all the earnings, you should expect – all things being equal – a 3.33% ROI. Is 3.33% ROI bad or good? Shouldn’t it depend on what else is available?
Who would have risked their money for a 3.33% expected return when there were 10% yield bonds around?
In low interest rates environment, and today’s one looks pretty stable, a high CAPE is normal.
Third, did I say 3.33% ROI? Well, CAPE considers last 10 years earnings. It doesn’t necessary mean it returned 3.33% each year. Current earnings are surely greater than last 10 years average. PE Ratio today is 24 for S&P500, so if the company doesn’t grow and you cash all earnings the ROI would be above 4%. Is 4% a bad ROI?
What if the company is growing a lot? Future earnings may be way bigger! Look at Amazon: its PE ratio is in the 240 territory and CAPE 687! That’s because the market expects the company to grow a lot!
Fourth, don’t forget that a 10 years rolling average in 2018 still accounts for 2008-9 bad earnings! Next year we’ll get rid of the great recession and CAPE bumps down by several points.
Fifth, not all markets are overpriced!
Here you can see a breakdown by country. It seems we should all buy Russian stocks 🙂

Sixth, not all sectors are overpriced!
Look at this S&P500 CAPE breakdown by sector. It seems we should all buy energy stocks 🙂

Tech and real estate are driving the market crazy since 10 years. Is this a new dot com bubble? Or a housing bubble? Already been there, aren’t we?
Eight, what the “E” part (earnings) represents has morphed over time due to changing accounting standards and company preference shifting towards buybacks instead of dividends [quoting reddit user u/Eli_Renfro in this comment to this amazing thread on r/financialindependence about high SWR. Go. Read. It. Now!]
To put it simple, it means earnings were reported “more generously” in the past. Cheating today is way more difficult and so CAPE values are inconsistent over time.
Want to read more about the topic? The blog philosophicaleconomics has two amazing posts about it!
Enough?
That’s a lot of material to process… And I’m confused now 🙁 What should I do? I don’t know!
I don’t know either 🙂
Define a clear strategy and stick with it.
Maybe if you feel the market is overpriced, which I translate into “I fear volatility”, switch to Yield Investing: REIT, Rental Properties, Preferred Shares, High Yield Dividend stocks, High Yield Bonds. Take a look at this amazing series on milennialrevolution!
Hold cash only if cash is what you need. Are you buying a house? Hold some cash. Are you planning a vacation? Hold some cash.
Personally, I still believe the economy is solid today.
Yes, I expect lower returns due to high CAPE in the near future, that’s why I go for a 3.5% SWR. My expectations are based on data gathered by the always-always-awesome Big ERN in the episode 3 of his SWR series.
But even if lower returns are expected, even if CAPE is high and even if mean reversion is showing us the bill I still can’t use this information to my advantage. I can’t exploit that. If I could, everybody else could too and there are smarter people than me (more informed, with more time and computing power too) trying to do that.
The economy is still rock solid though.
Quoting (again) Big ERN:

The dog is running ahead, maybe uncomfortably too much, but what I bet my chips on is the robust dog owner, steadily walking in the right direction!
Great timing for this article (pun intended). I’ve been holding to a lot of cash and I’m now slowly shifting my perspective. Thanks a lot RIP.
You’re welcome Paolo!
My suggestion for those who waited a lot and now have a significant lump sum is to go DCA (Dollar Cost Averaging) over few months, not longer than a year.
Very nice and interesting post RIP! Thanks. I completely agree that we should invest in emotionless manner. Timing the market is an impossible game.
Fantastic work here, R.I.P. Such a good response to those “waiting for the dip.”
Don’t be a dip. Draw up an IPS and stick with it.
Cheers!
-PoF
Thanks for stopping by PoF 🙂
You inspired me to write my IPS (which needs a major review soon) and that’s what I advice to newcomers.
This is a fantastic article! I’m bookmarking it as a reference when this topic comes up with friends. Found you through PoF, by the way. Thanks for sharing, PoF!
Thanks Matt, glad you found my article useful 🙂
Brilliant article!!!
Why dollar cost average? Just dump it in. If the market goes down, dupe the dip and tax loss harvest then reinvest. TLH is like free money when you go to spend your appreciated assets.
Nice article
Switching from holding a lot of cash (fear) to dump all at once (greed) may be a lot for many. Invest continuously a fixed amounts for a while mitigates highs and lows at the small cost of time out the market for the money invested later. It’s a psychological placebo for those whose main fear is making a mistake.
What an absolutely fantastic article! As a data hound myself, I loved the metrics you used to make your case. Really enjoyed the dog walking analogy as well.
I tend to be a perma-bear by nature. And while my affinity for optimization has served me well in other areas of personal finance, it’s been a hindrance when it comes to investing. I have missed out on too many good rallies over the past half-a-dozen years waiting for a dip and the right time to maximize my cost basis by buying low.
The current CAPE ratio does concern me. But I’ve found that comparing and contrasting market metrics from today to those of past decades isn’t an apples-to-apples comparison, as you deftly pointed out with your reference to the low interest rate environment. Basing my investment decisions on what I believed to be an over-priced market over the last few years by historical standards has cost me dearly. I have to keep reminding myself that the natural direction of the stock market is up.
I recently found myself in the unenviable position of having to choose between a now MUCH more over-priced and expensive market or the fear of continuing to miss out on larger and larger gains. Thanks for the data and the insights. Best article I’ve read this month!
Hi Mr FFP, thanks for stopping by and thanks for you amazing supportive words 🙂
I guess we all think we’re smarter than the average and do mistakes.
Truth is that the “dead investor” usually outperforms us.
Greed and Fear. Dead people don’t feel them!
Great post! I’ve heard many friends and colleagues ask about investing lately since the market “went down”. Looking at all of these times when that happened really puts today into perspective!
I’m right there with you on the market being overpriced according to the Shiller PE Ratio, and that all it means is to lower my SWR as well. The higher the PE Ratio, the more concern I’d be about investing a large lump sum – but that’s still a good problem to have!
As I understand the 4% retirement withdrawal rate, it is possible to run out of money in later years when there have been multiple years of market declines in the early years of retirement. In your 1929 example below, the retiree would be withdrawing 90% less after three years. No retiree can live on 90% less income and they therefore increase their withdrawal rate which causes them to run out of money in later years.
The depression era example you gave below seems like one example where the 4% withdrawal rate fails.
“Stock Market lost almost 90% from peak… It took almost 3 years to reach the bottom, with fake recoveries along the way. Imagine how it would have felt to you to keep losing money month after month after month for 3 years! It took 25 years to get back on track! That’s a really bad scenario (where the 4% rule apparently would have worked fine anyway).”
Hi John, the original setup for SWR is not a percent of current portfolio value but a percent of initial portfolio value.
In the example you mentioned (1929) you would not withdraw 90% less, but keep withdrawing initial amount, inflation adjusted. Which is even worse! Remember that you would also have earned some dividends to mitigate the need to sell stocks at low price, and sold some bond to buy stocks at rebalancing phase. That’s why you would have made it anyway with a ~3.5% SWR
You can try it yourself with retirement calculator 🙂
Hi Adam,
I guess one strategy could be to adapt his SWR based on current market valuation. That makes advancements toward FI more market agnostic.
Amazing read, RIP!
So much info that I can’t point out one thing to comment on, but it is a great post overall.
The reason that made me comment though, was that I also made such scenarios on my blog – I challenge a reader asking what would they do while presenting a portion of a chart and pointing out how the potential forecast fails (either losing money, or missing out on further gains).
Lastly, yes, decoupling emotion from investing pays dividends. In any sense.
Thanks for stopping by MonkWealth (nice name!)
I think this is once of my best posts. I loved writing, researching, and making fun of everything 🙂
I’ve read somewhere that the assets have to be uncorrelated. If we buy both high dividend yield stocks and high yield corporate bonds, aren’t they correlated?
Also, when it comes to REITs, I am not sure which is the situation in Europe, but in Romania they are highly overpriced. So if we look at this ETF: https://www.ishares.com/uk/individual/en/products/251808/ishares-european-property-yield-ucits-etf
do you believe it is fairly priced right now?
Last but not the least, we all know that even if we buy bonds, they act as a stock when trading them through an ETF. Should we make any technical analysis before going into a government or corporate bonds ETF? Like for instance bought the once which have already decreased in price for the past year?
why should high yield dividend stocks and high yield corporate bonds be correlated?
According to this asset correlation matrix on Charles Schwab (https://intelligent.schwab.com/public/intelligent/insights/whitepapers/asset-allocation.html) the correlation between US High Yield Dividend Stocks and Corporate High Yield bonds is in the range 0.3-0.7 (yellow color). They are somehow correlated, but not highly correlated.
Problem is that today’s global market makes hard to find (long term) uncorrelated assets.
About REIT, I have no idea how to tell if it’s currently overpriced. I just invest 5% of my Stocks AA (so 5% of 65% of my “NW minus cash reserve”) and stick with the plan.
I don’t think bonds traded thru ETFs behave like stocks. Of course there’s a bit of stock-like reaction to news, events… I mean it follows supply&demand like everything else, but the underlying asset (a loan instead of equity in a company) is different, and more predictable. Which means I expect that the stock-like behavior is limited to the short term (daily/weekly fluctuations)
Instead of buying the market, what do you think about factor investing and especially buying a MSCI World value factor ETF? It has better valuations and according to both academic research and practice, it produces better risk adjusted returns over the long run
https://www.ishares.com/uk/professional/en/products/270048/ishares-msci-world-value-factor-ucits-etf
Why would you ever buy growth stocks which are bought by non-thinking humans? Especially when japanification of developed markets is ahead with negative bond yields in Europe and Japan and negative expected returns for the junk US equities market where all idiots invest.
That looks promising, and surprisingly cheap for the much more complex strategy it implements.
But I’m skeptic about the robotization of Value Investing.
“undervalued stocks relative to their fundamentals” is not something I’d delegate to a bot for now.
Hey RIP,
thanks for the abundance of knowledge you share, definitely good reads!
I agree mostly with every concept/idea you present in this post and in the rest of your great blob, and I’m +1 to stay away from the temptation to time the market 🙂
given all this, I’m curious to know if you ever deepen into tech analysis and that sort of “voodoo” tricks to define limits and triggers to sell/buy.
No, I don’t do that.
While I actually enjoy learning more about the markets and while I’m also tempted to try to beat it, I realize that it’s a full time job. A job that can destroy you from the inside and that has no guaranteed outcome (it actually has a negative expected return). I prefer to spend my time doing other things. If I were to replace my current full time job earning me 250k+ CHF per year with one that consumes similar amount of time, it’s not funnier, and it brings me on average less than 0 per year… it’s just a huge NO.