Table of Contents
Hi dear RIP readers,
this is Part 2 of my series on my spreadsheets. In this post I’ll explain the structure of my spreadsheets, with a peak preview of the main 2020 Net Worth (NW) Sheet.
Next episode will be the longest, all devoted to how I track our NW.
Stay tuned 🙂
Enjoy!
Intro to my Spreadsheets
We’re going to deep dive into my spreadsheets, the thought process behind them, and many of the formulas.
I know that several among you copied my “RIP Net Worth” spreadsheet and adapted it for their own needs. Please, help yourself! I’m happy if you find it useful.
This series purpose is manifold:
- To inspire and motivate you, so that you too will start tracking your numbers.
- To guide you thru my own implementation of a personal finance tracking system.
- To help you following my monthly/quarterly financial updates.
- To make you too fall in love with spreadsheets <3
Even if you don’t want or need to copy the entire monster, feel free to use the formulas and/or the ideas behind them. Please ask questions if you need clarifications. I’m here for you 🙂
Mind that: I come from Italy and I live in Switzerland. I hold a C Permit thus I don’t pay taxes at source. I’m married and we have joined finances. We have a daughter. I’m also quite wealthy (not by Swiss standards though), have few sources of income, and juggle with three different currencies. That means my spreadsheets are strongly reflecting the specifics of my family situation. Probably, the closer in life you are to me, the most beneficial it will be to steal copy my spreadsheets and ideas 🙂
I’m also here to receive feedback from you! Don’t hesitate to leave a comment here – or in the spreadsheets themselves – if you think there’s something I should consider/improve/simplify.
This is the link to my public Spreadsheet
Now fasten your seat-belt, we’re taking off 🙂
Naming, Structure, and Conventions
… Not today though! The real meat is coming in part 3. This post is mostly a preparation with naming, structure, and few non-NW specific standards I adopt in my spreadsheets 🙂
Let’s try to get confusion and ambiguity off the table before we go deep.
Spreadsheet vs Sheet
I call spreadsheet the entire file.
Rip Net Worth is a spreadsheet.

I call sheet a single “tab” within a spreadsheet.
Historical Net Worth is a sheet within “Rip Net Worth” spreadsheet.

If I tell you “I don’t give a sheet” it means I don’t want to make public one of my private… ok, what a sheetty joke 😀
September 2020
I’m writing this post series during September 2020, I think guess hope I’ll have all the posts published before the end of the month.
My spreadsheets keep changing though. You might find them obsolete/not relevant anymore in few years, or even in a few months.
Actually, the process of explaining my spreadsheets exposed some bugs, inefficiencies, confusions I want to fix straight away. Which means explicit references to rows/columns (and even sheets names) are pretty much guaranteed to go out of sync before the end of the year!
This is a good thing. it’s a mix of Feynman Technique and Rubber Duck Debugging.
Feynman Technique, according to Farnam Street blog:
Take out a blank sheet of paper. At the top write the subject you want to learn. Now write out everything you know about the subject you want to understand as if you were teaching it to a child. Not your smart adult friend, but rather a 12-year-old who has just enough vocabulary and attention span to understand basic concepts and relationships.
It turns out that one of the ways we trick ourselves is that we use complicated vocabulary and jargon and it masks our lack of understanding.
Rubber Duck Debugging, according to Wikipedia:
In software engineering, rubber duck debugging is a method of debugging code.
Many programmers have had the experience of explaining a problem to someone else, possibly even to someone who knows nothing about programming, and then hitting upon the solution in the process of explaining the problem. In describing what the code is supposed to do and observing what it actually does, any incongruity between these two becomes apparent.
More generally, teaching a subject forces its evaluation from different perspectives and can provide a deeper understanding. By using an inanimate object, the programmer can try to accomplish this without having to interrupt anyone else.
So… thank you my rubber ducks 😀
Anyway, to make the content a bit more time resilient I try to add as many screenshots as I can, so that you can track the changes if you need.
Public vs Private Environment
I’ve been tracking my sheet (“Please, RIP, stop!“… “I know, but it’s so easy!“) since forever, but I only started blogging in June 2016. I decided that I wanted to become the most transparent blogger ever existed. I thought there was value in sharing my thought process, decisions, and actual numbers on a monthly basis with my readers and the entire world.
But I also decided to keep my real identity private, which means I couldn’t just publish my spreadsheets in their original form: too much Personally Identifiable Information (PII). I had to scrap them and publish some copy/subset of the original.
I call private environment (or private spreadsheets) my personal spreadsheets not shared with you, while public environment / public spreadsheet(s) the shared one(s).
I’ve put “s” in parenthesis because at the moment (September 2020) I only share a single public spreadsheet (for finance tracking) that hosts many sheets. This might change in the future, but we’re now in September 2020.
If you’re a Software Engineer you know how painful it is to keep in sync cut&paste code. When I started blogging I had a more complicated way to pull data from the private spreadsheets into the public one, via an intermediate spreadsheet where all the magic was happening. I wanted to keep a single source of truth, but every time I had to add/remove a row in the private spreadsheets It was a hell of a job to keep them synced.
I decided to move toward openness, and to make the two environments almost identical. For NW, Income, and FIRE Metrics tracking the two sheets are exactly the same, just some asset name redacted for privacy.
The main remaining differences are in expense tracking: I only share a simplified version of my private expense tracking on the public side. The reason why I don’t share my full expense list (for now) is privacy. Not because of “I’ve something to hide” privacy argument, but because of “Birthday gift for Mr. DIP = 1.99 CHF” privacy argument (“RIP, you’re a cheapass! You told me it was an original Rolex!“).
I’m going to deep dive into my private environment in this series, adding templates for the missing sheets in my public environment.
Public and Private Environments Structure Overview
The Private Environment is composed by the following:
- A single Net Worth Spreadsheet.
- An Yearly Expenses spreadsheet for each year (since 2016)

The (private) Net Worth Spreadsheet is composed of:
- A set of Yearly Net Worth sheets, one for every year since 2013, and an aggregated one for 2004-2012
- A set of other monitoring/tracking sheets: Investing, Historical NW, NW by Currency, NW by Asset Class, Income, Ravenna Threat, and few more.
For visual reasons, I prefer to have current yearly NW sheet as first sheet on the left, then all the “other sheets”, then all the previous yearly NW sheets.
![]()
The entire content of my private NW spreadsheet is mapped into my public environment and available for you.
Each (private) Yearly Expenses Spreadsheet is composed of:
- A Graphs sheet with graphs, tables, pie charts to enable some visualization and intelligence over the data.
- An Expenses Short sheet. With monthly, average and year-to-date expenses for each primary expense category.
- An Expenses (full) sheet. With monthly and year-to-date expenses for each primary and secondary expense category.
- A set of Monthly Expenses sheets, one for each month of the year, with all the individual expenses. Each one with date, currency, amount, primary and secondary category, and notes.

Each private Yearly Expenses sheet is mapped into my public spreadsheet as a single sheet that’s a merge of “Expenses Short” and “Graphs” sheets. I interleave the public Yearly Expenses sheets with public yearly Net Worth sheets, keeping current yearly expenses sheet closer to current yearly net worth sheet, before the “other” sheets.

That means my public spreadsheet is missing the fine grained details of my expense tracking system.
“RIP… I don’t…”
Ok, re-reading the above confused me as well. I’m just saying that the (single) public spreadsheet contains ALL the sheets in the (single) private NW spreadsheet AND a tab for each private yearly expenses spreadsheet that’s an expense summary, i.e. it’s lacking individual expenses and secondary categories… Is it better now?
“Yeah… 😐 ”
Cool!
But do not worry! For didactic purposes I copied a portion of the 2020 Expenses spreadsheet into a new spreadsheet in the public environment for you, so that you can follow me in the expense tracking section few chapters down the road 🙂
Yearly Net Worth Sheet
This is the real behemoth! Every year I create a new sheet in the Net Worth spreadsheet as a copy of the one from the year before. I then remove rows that are no more relevant (accounts closed, investment closed, tax years resolved, estates sold), clear cell values, and spend few hours brainstorming about significant changes in the way I track my finances.
Today, the 2020 Net Worth sheet has 168 rows, with more than 100 of them relevant to the Net Worth section.
Yes, there’s a bit of overloading on the “Net Worth” word: there’s a Net Worth Spreadsheet, that contains Yearly Net Worth Sheets (one per year), each one having a Net Worth section – along with other sections. Sorry for the confusion. I think the main spreadsheet should just be renamed something like “RIP Finances” instead of “RIP Net Worth”, and the non-NW sections of the Yearly Net Worth sheets should be moved into other sheets. But it takes time…
Anyway, my NW section started very small 16 years ago. Do not let today complexity fool you. Take a look at <a /nw”>2004 – 2011 (before I moved to Switzerland). My Net Worth crossed 10 rows in 2011! Life was easy back then.

So don’t get scared by the complexity of my sheets. You can start simple. Along your road to FI, complexity will show up when it needs you, do not worry 😉
In my case, complexity did show up: the latest (2020) Yearly NW sheet contains many sections. We’ll go thru them in detail. The NW Section will be explored in part 3. Cash Flow section in part 4. Fire Metrics in part 5. Other parts would cover investments tracking (part 6), expense tracking (part 7), and whatever it’s left (part 8).
Before jumping into the real stuff, let’s conclude this post talking about Yearly NW Sheet structure.
YNW Sheet Structure
I’ll be referring from now on to the 2020 Net Worth sheet, under the assumption that’s populated until column L, i.e. September. if you read this in few months or years from now things will be different. They surely will.
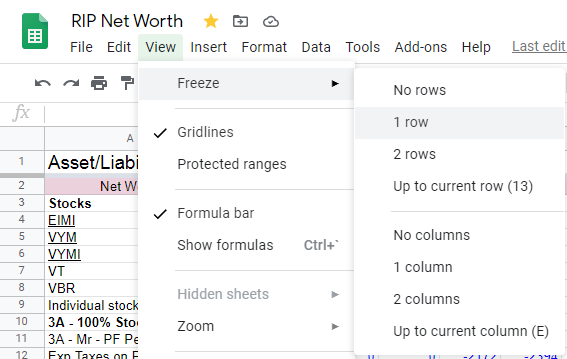
First row is a header row. I freeze it for graphical convenience. I want to see the month names when I scroll down on mobile or desktop. For the same reason I freeze the first 2 columns (Asset/Liability and Currency). I want to see what entry I’m interacting with when scrolling horizontally, especially on mobile.
For example, in the below screenshot I know that the red cell (L63) is September Total Net Worth in EUR currency without having to scroll left and up to check row and column headers.

First Column is a header column that tells us something about the row type and expected content:

Each Row can be either a section separator (row 2, “Net Worth”, red background), sub-section separator (row 3, “Stocks”, bold), individual asset/liability (rows 4-8), aggregated assets/liabilities collected in a single entry (row 9), sub-sub-section separator (rows 10 and 13), and more.
Second column is the currency of the asset (when applicable). F for Swiss Franc, E for Euro, and D for US Dollar. I own assets in those three currencies, and I need a way to handle them.
Third column (col C), is previous year final value of each asset (when applicable). In order to quickly look up January and year-to-date (and year-over-year for previous years) changes in individual assets or entire NW.
The following twelve columns (col D to O) represent monthly values (January to December) for each entry. Snapshots are taken on the last day of the each month. If I can’t for some reason, I’ll take a snapshot as close to end-of-month as I can.
The process of taking a monthly snapshot consists in generating the new column for the coming month, and freezing the moving parts of the ending month (usually currency pairs value, and exchange traded assets value). I will explain the full process in detail in a future post on this series.
The column relative to current month represent the live value of each asset/liability. Ok, not exactly “live”. I’m not updating cash and credit card balance as soon as I pay a bill. I check my balances – and update the relative cells – roughly once per week.
At the end of the month I religiously check all accounts and synchronize my sheet before snapshotting it. If there are retroactive actions that need to be taken later in the year, I’ll go back and update the frozen snapshots.
Column P is a copy of the current month. It always represents current live NW in current year sheet. It’s there because some formulas in other sheets (like “Investing”) need a way to lookup “current value of asset X”, and I didn’t want to make lookup formulas too complicated. Column P holds current values, no matter in which month we are. When the year is over, column P will be a snapshot at the end of the year, and identical to column O. Except for the “NW Delta” rows and also the “Cash Flow” section. More on this later in the series.
To populate column P with “current values”, which is also “rightmost values among column range D to O”, I use the index-count trick:

Index returns the value of a cell in a range with given row and column offset. The range for each row is a 1×12 box Dx:Ox (where x = row number). The row offset is always 1 (there’s only 1 row in the range), and the column offset is the count of not empty cells in the range.
The assumption is that if a row contains numeric values, you never leave holes behind. You need to fill every cell for that row up to current month’s column, eventually with zeros.
Full formula, for Cell P4:
=index(D4:O4,1,counta(D4:O4))
Column Q, R and S could and should be merged in two columns instead of three. They represent different things in different sections. Usually, averages, forecasts, price fluctuations of quoted securities and so on.
Ok, enough for now. Next chapter we’ll take a look at the “Net Worth” section of the “2020 Net Worth” sheet of “RIP Net Worth” spreadsheet… Ok, I got it. I need to rename stuff 🙂
Have a nice day!
L’unica cosa che mi viene in mente leggendo le prime due puntate e’: Chapeau!
Stai facendo (e ci stai regalando) un grande lavoro!
ciao – leguf
…then the third episode (coming out next Wednesday) will blow your mind 🙂
Hello Mr Rip
Why go with Vymi considering that the dividends are heavily taxed in Switzerland ?
Why track expenses yourself? Net worth is what matters in the end so I only track my net worth in excel and rely on my bank for tracking expenses – PostFinance as a great visual tool that facilitates this expense analysis.
Why VT and not Vwrl for the total market, considering the Risk on the us estate taxes ?
Thanks, I love your blog ! Will remember Feynman and rubber techniques 🙂
VYMI: “heavily taxed” means at marginal income rate. Yes, it’s still not fun, but I’m betting value stocks are underpriced now. And the “high” dividend yield of VYMI is in the neighborhood of 2.2% (VYM is at 3.7% yield right now), not much different from the S&P500 yield.
Tracking Expenses: because I’m not a millennial. Because I don’t pay every expense with the same instrument. Because PF visual tool sucks asses. Because if I change bank in 3 years I’d lose my expense tracking history. Because within the visual tool of PF I see a giant block of ~2k per month which is “credit card expenses” and what am I supposed to do with that?
VT: I’ve done my research and found ZERO investors in Switzerland that ended up paying any US Estate Tax. There’s an exemption of 5M or 10M. Plus US domiciled ETFs have laughable spreads, laughable TERs, and laughable trading fees
I am making the same bet on value stocks through IWVL 🙂 Reversal to the mean is the most important concept I learned through my readings on investment. Let’s see how long the value trap lasts!
I am still unsure about the value of tracking expenses. Let me develop on this. As a FI person, you pay a lot of attention to your expenses: they represent a limited share of your income. On that limited share, I expect that most of your expenses are constrained expenses: Home / food / daycare / taxes, these represent probably the majority of your spend, and I expect you to have already optimized these. So, is the opportunity cost of tracking expenses reasonable?
VT – very good point. It looks like I had an irrational anxiety about this. There is a good post analyzing the treaty between CH and US and it confirms your analysis. Thanks ! https://thepoorswiss.com/us-estate-tax-swiss-investors/#:~:text=The%20law%20article%20states%20that,critical%20part%20is%20the%20proportion.
Good points on the expenses tracking, let’s keep the discussion flowing 🙂
I’ll drop sparse thoughts both in defense and in accusation of my expense tracking system (I’m not here just to defend my ideas):
– YES, of course there’s some “old habit that doesn’t want to die”. I.e. I still try to optimize things that are probably not worth optimizing anymore. I use double blades razors, and use them twice before thrashing them, buying them in bulk in Italy, and shaving once every two weeks. Yay! This brings my shaving costs per month down to 0.15 Cents! Then we decided to send our daughter one extra day per week in the child care: 461 CHF/Month.
– I’m not FI in Switzerland! If I were, I’d just be paying attention to the overall expense level, and maybe going deep if/when they cross some threshold. But I’m not FI, and I still want to monitor them closely.
– On the other hand, two-thirds of our average monthly expenses are fixed costs. To optimize them means downsizing the flat (we moved in not even a year ago and we love our new flat), or reducing number of days in child care for our daughter.
– The one-third that’s “optimizable” is all in the credit card statement, i.e. a single source of data. Which means we could simplify and monitor total expenses PLUS data CC statements.
– I started blogging in 2016. I started tracking expenses for documentation purpose. I thought it would be useful for my readers, even though I was frugal by heart.
– In fact I wasn’t monitoring expenses down to the Cent until 2016. I knew I had them under control.
– But… we married (2017), our daughter arrived (2018), and we upgraded the flat and sent her to expensive child care (2019). Our expenses are exploding. I’m happy I had the tracking system in place so that I can keep looking closely at them.
– I like the intelligence I can run on my own data. I’m actually thinking of having a database instead of a series of spreadsheets..
– in the end, it only takes few minutes a month
lol
Being in a similar situation, for me the tracking of expenses is useful to communicate with my wife and keep things under control. So I my tracker I just take the full year total and split of expenses and compare it year on year. This leads to interesting discussions – ” see darling how we keep increasing our expenses double digits year on year while our revenue does not increase that fast” 🙂
“that must be our taxes as we earn more than last year”
“hmm, we were taxed at source so that would not be visible. And we paid the same amount after the at source deductions”
” then that must be …” …
🙂
One post suggestion – can you highlight why it is interesting to grow wealth? My wife (otherwise the most perfect person on earth” is in style ” what is money for if I do not spend it?”. Would love to see your arguments in this area. I am sometimes running dry … ” but then you are free. you can stop working if you want. You are not poor when you retire” …
I like the way you use expense tracking 😀
What I hear from you is that you have hard time communicating your values to your wife. I must admit I’m not doing much better here. My wife understands the principles and the reason behind my “delayed gratification” problem, but sometimes it’s hard to explain why we should pass on this innocent 10 CHF recurring expense that everyone in our circle is indulging in. “We can afford it” are the four most dangerous words in personal finance.
There are two ways to go: the incremental and the revolutionary way.
The incremental way aims to make small improvements toward the goal. I think there’s a Wheaton Scale in personal finance, where you can relate and even admire someone which is one or two steps ahead of you, but you perceive as a weirdo someone which is 3 or more levels ahead. So the way to go would be to try to communicate as someone just a few steps ahead, not kilometres. This is the best way in my opinion to reach a convergence, but I’m not good at it.
The revolutionary way is to expose the SO to the vision, the benefits of the final destination. then draw together a plan to go there. I try to do this in my family, with mixed results. I have my wife onboard, but I perceive she’s not fully convinced.
Since I’ve read Paul Graham’s 2006 essay “How to do what you Love” I think I got why the revolutionary strategy might fail:
You might be in a father-child relationship with your wife about money. I surely am. I feel the pain of working. I envision the relief of not working for a living, and only enjoying my hobbies and my free time. I don’t care about that cool brunch at that cool restaurant every Saturday. But my wife has a different experience of reality: she doesn’t feel the pain of my work (just a bit, as a side effect of my unhappiness), she doesn’t have strong passions like I have, and she’s not as indifferent to that fucky brunch as I am.
No way I can clone my vision into her brain.
Need to find a better strategy.
Hi Mr RIP, I just wanted to thank yo for sharing your spreadsheet.
Since the past year I have been tracking my finances with spreadsheets (inspired by your spreadsheet). Much simpler than yours, but has been a tremendous help in keeping track of my financial behaviors. An eye opener.
Cool! I’m happy it’s been useful for you as well 🙂
Hi Mr RIP, I am Italian and I’ve enjoyed your spreadsheet as well, congratulations for your work!
I was currently doing the same but only tracking expenses and passive incomes in dedicated sheets. I’ve never considered to put everything in one NW sheet so thanks for your hint!
Saying this, I am also a huge fan of JL Collins, who strongly believe that only VTSAX and VTBLX are needed. May I ask you why do you use such a diversification of ETF? Is it just for a diversification matter or do you have other thoughts behind it?
Another curiosity is about your home. Are you a home owner? What do you think about renting vs owning topic?
Excel vs Google Sheet: apart from the sync feature among devices, do you see any other pros about using Google sheets ?
Looking forward to part 3 🙂
I’m sorry, it’s me again but I have so many questions I would like to ask you since I like the way you write and think! 🙂
What do you think about the dollar cost averaging?
It’s kind of tricky for me because if we are in an increasing trend scenario, the average cost will increase as well so for this reason I’m not so happy to regularly invest. This means that I keep my money on the broker in cash, ready for any drop in the market. In this way I will never invest.
Did you have the same issue in the past? How did you solve it?
Thanks if you have the time to reply !
In theory, DCA is inefficient compared to just dropping a lump sum.
In practice, whatever makes you more comfortable works best. With DCA you reduce entry point risks, and that’s good. With DCA you can be as “algorithm” as possible (invest X every first Monday of the month) and avoid the temptation of timing the market.
yes, exactly. I think the same but if I want to regularly invest a part of my salary, I have no other options than DCA.
As you have suggested, I need to invest X every month no matter what the market value is. Thanks for your thoughts !
Part 3 is coming tomorrow, and it’s veeeery loooong 🙂
M huge diversification of investments is the result of a strategy that changed so many times and needs a review as soon as I clean the fog surrounding my future (work? not work? Switzerland? Italy? One kid? More kids?).
Anyway, the extreme simplification of “the simple path to wealth” might be too extreme for me. I think I want to be slightly more active in the market, but just a bit. Your mileage may vary.
I’m not a home owner. i used to have a flat in Italy but I sold in July 2019.
I don’t see any reason to use Excel over Google Sheets. Offline files? What year is that?
I get your point 🙂
The reason is, I am using an Excel file but uploading it on Dropbox.
So in this way it’s kind of having online files.. I’ll try to work a little bit with Google sheets, maybe I’m going to like it more.
ps in any case, I am bit concern about data safety ..
Do you have excel installed on all your devices? including smartphones?
Is Dropbox safer than Google?
no, exactly. I just wanted to say, I am bit concerned with both solutions Dropbox or Google but it’s too good to have all our data on the cloud so I guess we just need to go for it.
Hi RIP,
thaks for sharing your spreadsheets. I always tracked my expenses with phone apps, but I would like to go up to the next level with spreadsheets. It’s probably more difficult, but I bet it will be much more flexible. My spreadsheets will be simpler than yours, but it is a great help to have a baseline.
Thank you very much,
Daniele
P.S. I just started reading “Your money or your life” following your advice, it seems really interesting, thanks again!
Awesome, welcome to amazing world of spreadsheets 🙂
Buonasera,
avevo già un mio foglio di calcolo piuttosto dettagliato ma questo è davvero di un altro livello; non ci ho messo molto a cestinare il mio e a trasferire tutti i dati sul tuo modello.
Non riesco però a trovare la giusta collocazione per il pillar 1 italiano cioè la pensione INPS in quanto non è dato sapere l’impiego del denaro versato.
Si può considerare alla stregua di un portafoglio 100% bonds o, in virtù del fatto che si tratta di soldi vincolati fino ad una data incerta causa possibili variazioni normative, è preferibile escluderlo dal conteggio del proprio net worth?
E’ la seconda volta che ti pongo quesiti e non vorrei risultare pedante pertanto qualora ce ne fosse la possibilità mi prenoto per la riapertura delle consulenze one to one.
Grazie mille
Haha contento di averti ispirato 🙂
La pensione INPS io la considerei come il Pillar 1 Svizzero, cioè non la considererei affatto fino a 10 prima della data di pensionamento.
Poi si può modellare come “Lump Sum Value” come ho indicato qui: https://retireinprogress.com/lump-sum/
Ciao Rip! Ti seguo già da un po’ di tempo su YouTube, ma ho da poco scoperto tutta la mole di materiale qui sul blog, e lo sto pian piano riprendendo. A proposito di questo post, volevo chiederti perché effettui manualmente uno snapshot ogni mese, e non usi semplicemente delle formule per filtrare i dati fino a quel momento? Con l’inizio del 2024 vorrei iniziare anche io a fare un lavoro di spreadsheeting come il tuo, e stavo cercando di capire quale fosse la soluzione migliore tra fare snapshot manuali, o ricorrere alla formule. Così su sui piedi mi verrebbe da usare le formule, ma visto che tu fai questo lavoro già da anni, credo che hai considerato meglio di me i pro e contro delle due alternative, e mi piaceva quindi avere una tuo opinione in merito.
Grazie Rip, e buone feste!
Googlefinance riduce la granularità dei dati nel passato. A un certo punto ti trovi degli “N/A”.